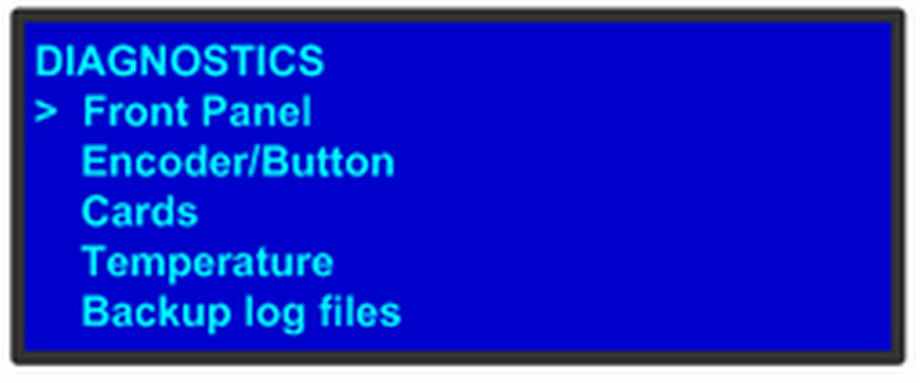
The following illustration shows the Diagnostics submenu, which you access from the System menu.
Image 5–19
The Diagnostics options allow a user to check if the Event Master unit is functioning normally. Front panel and card operations can be checked. Various system temperatures can be monitored and backup log files can be saved for customer service troubleshooting.
Front Panel
When Front Panel is selected to be tested, the VFD display will initially be blanked. Then the 24 x 4 character grid will start to show from the dimmest setting to the brightest setting. At this point a user can determine if any of the pixels or if a character segment is bad in the display.
After several seconds of showing all pixels on at the brightest setting, the system will automatically advance to the ENCODER/BUTTON TEST menu (the next menu).
Note: Directly select “Encoder/Button” from the Diagnostic menu will allow the user to test the keys and knob without the need to see the VFD being tested.
Encoder/Button
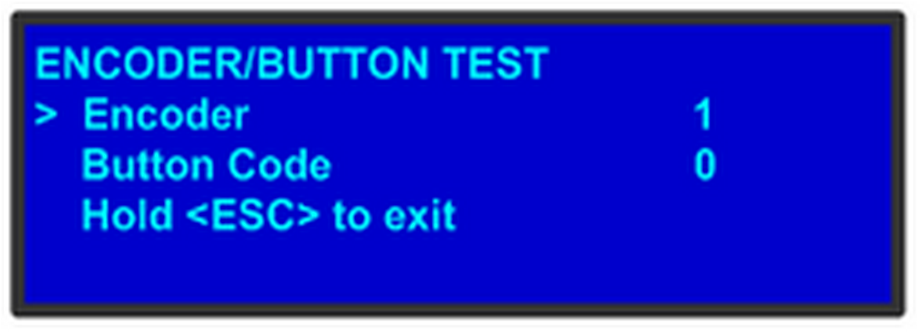
Image 5–20
The ENCODER/BUTTON TEST menu allow the user to test the keys and knob.
When the knob on the front panel is rotated, a number will be displayed on the encoder line. The larger the number, the faster the knob was rotated. The number will show as positive or negative depending on the direction the knob was turned.
Pressing any key on the front panel will show the Button Code for the key.
Button
Code
ESC
0
PWR
7
SEL
14
Hold ESC to exit and return to the DIAGNOSTIC menu.
Cards
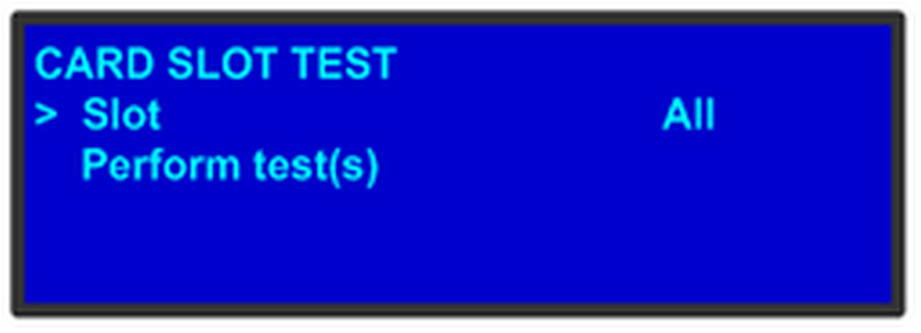
Image 5–21
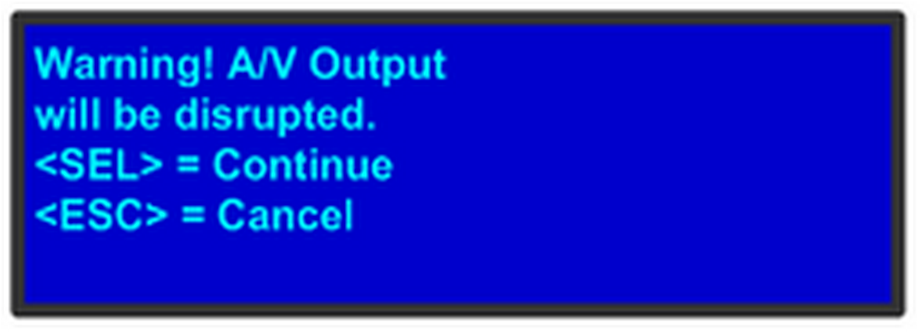
The Card Slot test will perform a variety of diagnostics for an individual card or for all cards. This is a quick way to determine if a given card is having a problem. After selecting a Slot number or choosing All cards to be tested, the following message will be displayed.
Image 5–22
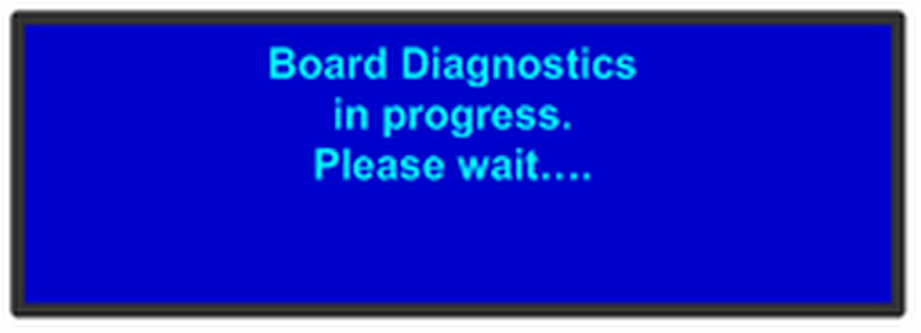
Pressing SEL to continue will start the diagnostic testing. The following message will be displayed.
Image 5–23
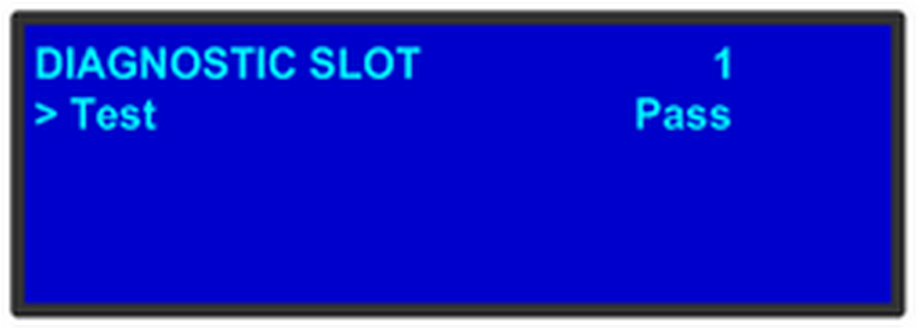
If only one slot was selected for testing, a simply PASS/FAIL result will be shown for that slot.
Image 5–24
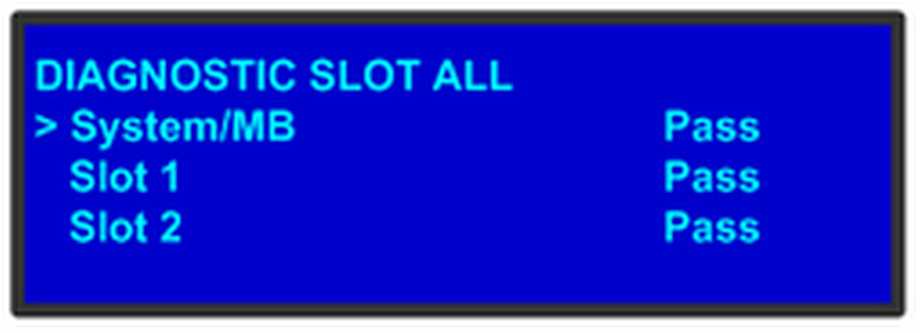
If all slots were selected for testing, the PASS/FAIL result will be shown for all slots.
Image 5–25
Note: If a slot is not populated with a card, the result will show EMPTY.
Temperature
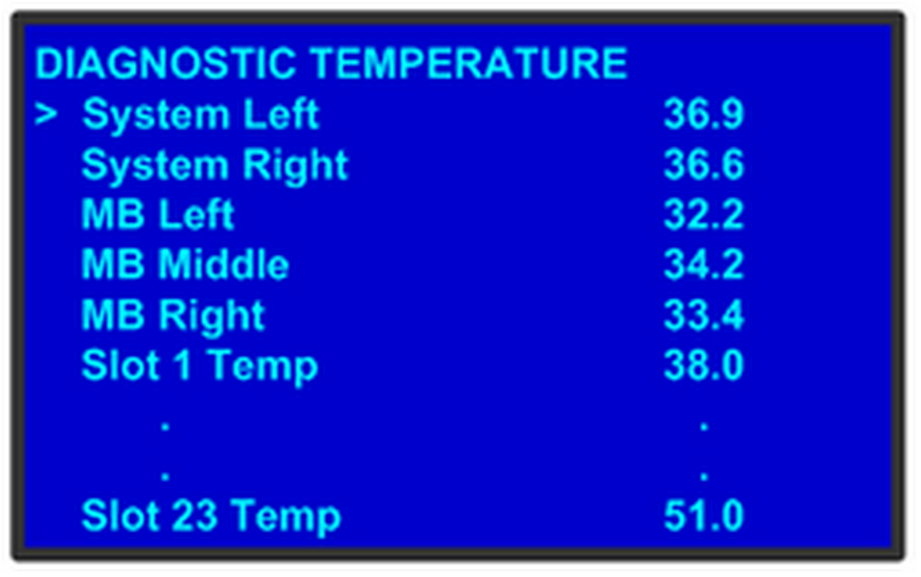
Image 5–26
The DIAGNOSTIC TEMPERATURE menu will show real time measurements for the System, Motherboard and all card slots. All temperatures are shown in degrees Celsius.
Note: FPGA temperatures may reach as high as 85°C under normal operating conditions. Temperatures above 85°C may affect processing performance.
Backup Log Files
Backup log files can be saved for customer service troubleshooting.
Note: In the event the log files of the Event Master unit need to be backed up, first install a USB stick in the unit's front panel.
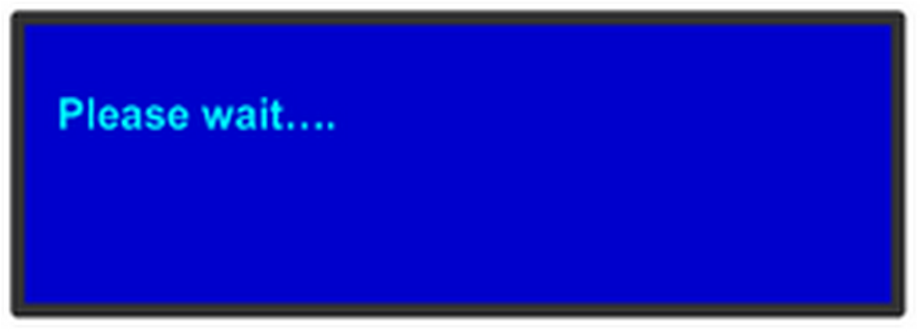
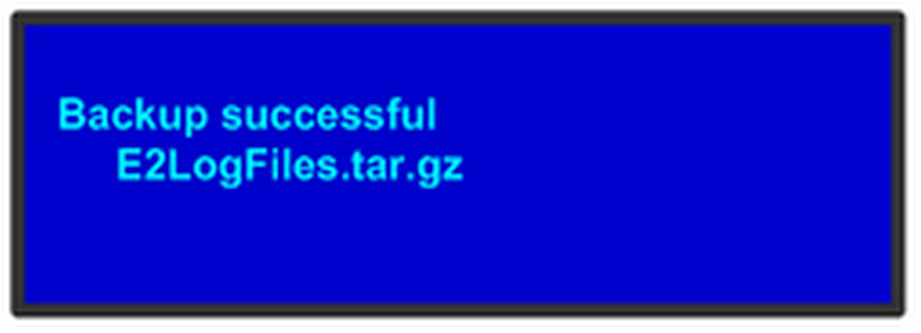
When Backup Log Files is selected, the system will immediately write its log files to the USB stick. The following menus will be shown during this process and the Event Master unit will automatically return to the DIAGNOSTIC menu once this process is complete.
Image 5–27Image 5–28
Note: The file name will be “E2LogFiles.tar.gz”, and it can be found on the USB stick under the “E2\backup” directory.