| Shows a thumbnail of the device. | |
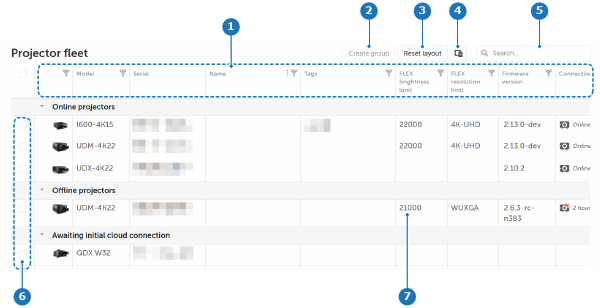
| Model name of the device. | Automatically filled in when registering the device. |
| Serial number of the device. | Automatically filled in when registering the device. Hovering over the number reveals the copy-to-clipboard option.  Copy to clipboard. Copy to clipboard.
|
| Name given to that device. | Click the name or the empty field to modify or enter a new name. |
| Displays all tags applied. | Click the field to add or delete tags. |
| Displays the firmware version currently installed on the device. | Indicates if the firmware needs to be updated:  Firmware update available. Firmware update available.
 Critical firmware update available. Update the device as soon as possible. Critical firmware update available. Update the device as soon as possible.
|
| Indicate the device’s connection status. |  Device is connected to the cloud platform. Device is connected to the cloud platform.
 Device is not connected to the cloud platform. Device is not connected to the cloud platform.
If the device is not connected to the cloud platform, the number of days since its last connection is displayed. |
| Indicate the light source status. |  Light source is currently off. Light source is currently off.
 Light source is currently on. Light source is currently on.
|
| Indicates the device’s health status. |  Normal: The device is working properly. No errors or warnings are present. Normal: The device is working properly. No errors or warnings are present.
 Caution: some actions are needed in order to keep the device operational. The caution icon is followed by the number of cautions. Caution: some actions are needed in order to keep the device operational. The caution icon is followed by the number of cautions.
 Warning: the device is reaching a state where it may become impossible to keep it in an operational mode if no action is taken soon. The projector will continue to operate as long as possible. The warning icon is followed by the number of warnings. Warning: the device is reaching a state where it may become impossible to keep it in an operational mode if no action is taken soon. The projector will continue to operate as long as possible. The warning icon is followed by the number of warnings.
 Error: the correct or safe operation is no longer guaranteed. The device will switch to Ready, or go to Standby if the error continues. The error icon is followed by the number of errors. Error: the correct or safe operation is no longer guaranteed. The device will switch to Ready, or go to Standby if the error continues. The error icon is followed by the number of errors.
|
| Shows the most recent IP address. | Hovering over the IP address reveals the copy-to-clipboard option. Copy to clipboard. |
| Displays the FLEX brightness limit. | |
| Displays the FLEX resolution limit. | |
| Displays the notification status. |  Subscribed to receive notifications for the device. Subscribed to receive notifications for the device.
 Not subscribed to receive notifications for the device. Not subscribed to receive notifications for the device.
|
| ... | Expand or collapse the secondary information row, which displays details such as and (if available), measured in hours. | This column does not has a name. It is always the last column in the dashboard. |
| Shows the subnet mask. | Column is default hidden. Use the feature to view the column. See “Column chooser”. |
| Shows the default gateway. | Column is default hidden. Use the feature to view the column. See “Column chooser”. |
| Shows the name servers. | Column is default hidden. Use the feature to view the column. See “Column chooser”. |